The information provided by the performance pack in any JMX client console provides insight into which SQL sentences are executed most often in the application, and which ones take longer to execute. The same information is provided by the application's procedures.
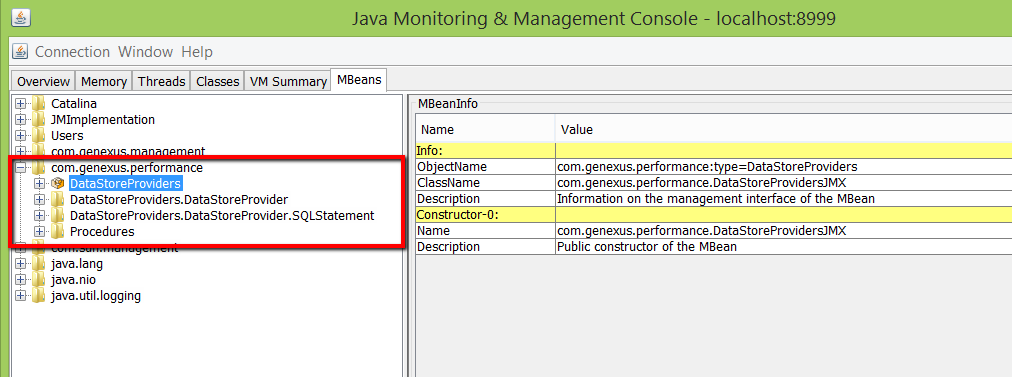
The performance pack of JMX console looks as shown below. It has four nodes, which are summarized below:
- DataStoreProviders. It provides summary information on the SQL statements executed by the server.
- DataStoreProviders.DataStoreProvider. It provides information on the SQL statements that were executed by a specific object.
- DataStoreProviders.DataStoreProvider.SqlStatements. It provides information of a specific SQL statement.
- Procedures. It provides information on the procedures that were executed.
For more information, read Management and Performance information using JMX or WMI.
The information provided by JMX can be grouped in order to get more specific information. For example:
- Which SQL sentences are executed most often in the application
- Which SQL sentences take longer to execute in average
The information of the DatastoreProviders node can be dumped into an XML file using the operation "dump DataStoreProviders information".
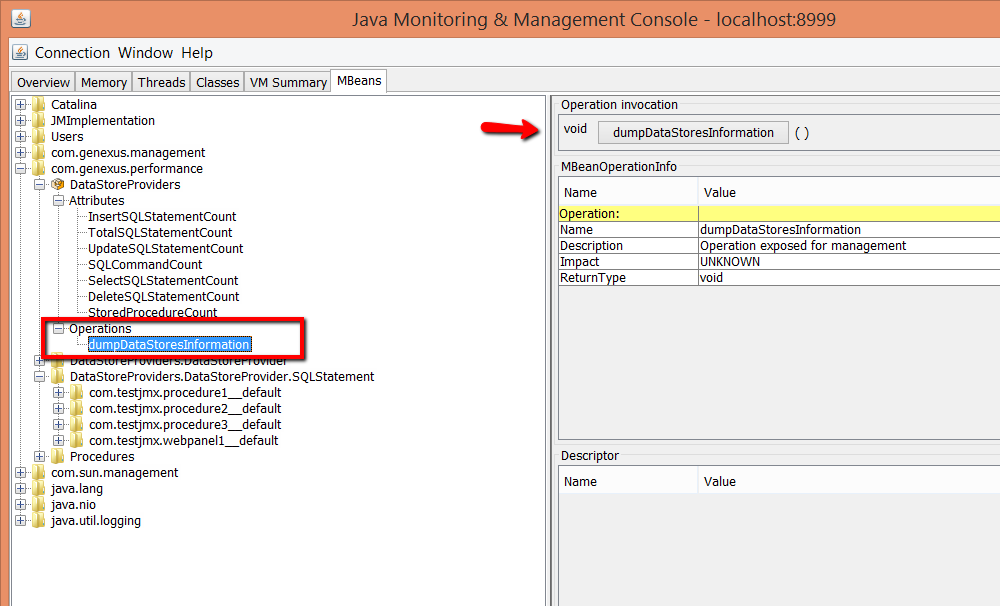
After that, an XML file is saved in the web server root.
The XML file contains the information of the entire tree, summary information on the SQL statements executed, and the information of each DataStoreprovider.
The main tag of this file is DataStoreProviders_Information which sums up the SQL statements executed by the server.
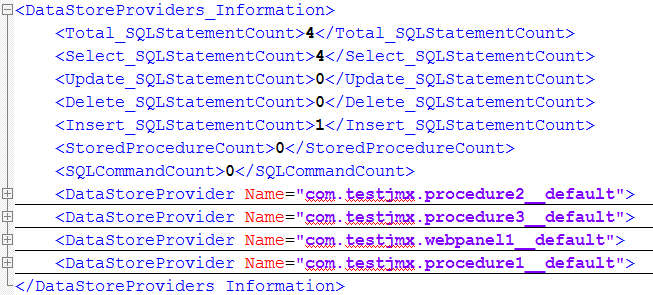
Nested to DataStoreProviders_Information is the information of each datastoreprovider, e.g. DataStoreProvider Name="com.testjmx.procedure2__default"
Nested to it, the SQLStatement tag shows each of the SQL statements corresponding to this Datastore provider.
<DataStoreProviders_Information>
.............................
<DataStoreProvider Name="com.testjmx.procedure1__default">
        <Total_SQLStatementCount>1</Total_SQLStatementCount>
        <Select_SQLStatementCount>1</Select_SQLStatementCount>
        <Update_SQLStatementCount>0</Update_SQLStatementCount>
        <Delete_SQLStatementCount>0</Delete_SQLStatementCount>
        <Insert_SQLStatementCount>0</Insert_SQLStatementCount>
        <StoredProcedureCount>0</StoredProcedureCount>
        <SQLCommandCount>0</SQLCommandCount>
        <SQLStatement>
            <SQLStatement>
                <![CDATA[SELECT [clientName], [clientId] FROM [client] WITH (NOLOCK) ORDER BY [clientId] ]]>
            </SQLStatement>
            <Count>1</Count>
            <LastExecute>19 Dec 2014 16:14:05 GMT</LastExecute>
            <TotalTime>35</TotalTime>
            <AverageTime>35.0</AverageTime>
            <WorstTime>35</WorstTime>
            <BestTime>35</BestTime>
        </SQLStatement>
    </DataStoreProvider>
</DataStoreProviders_Information>
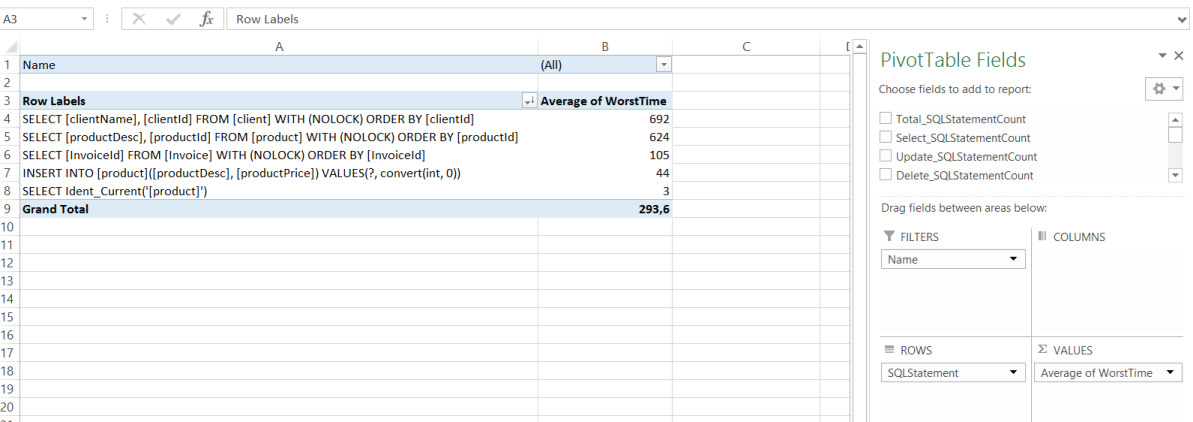
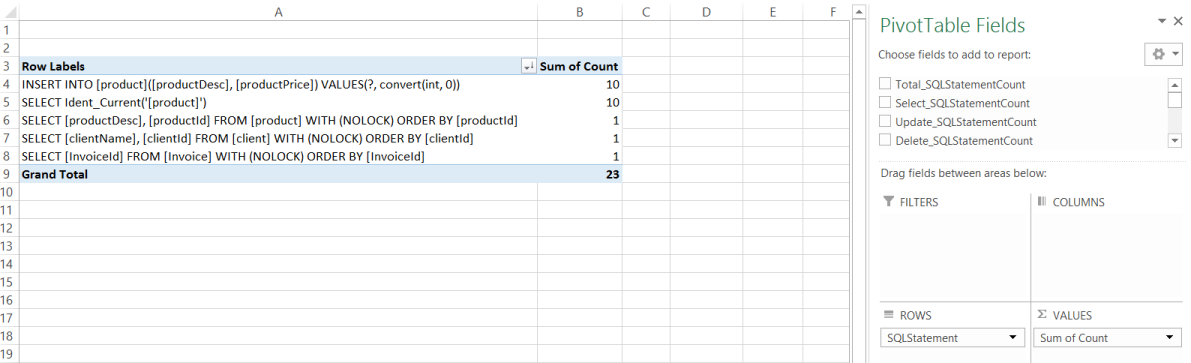
You can open the dump XML document using Excel and create a pivot table to get the information required.
Given that the "SQL Statement" tag inside the XML dump has "count" information which tells the number of times the statement was executed, you can create a pivot table to group the SQL statements and SUM the number of times that each of them was executed.
You can also identify the SQL statements that take longer to execute by creating a pivot table where the SQL statements are grouped and an average worst time is taken.
The worst time is a parameter which is also part of the "SQL Statement" information.