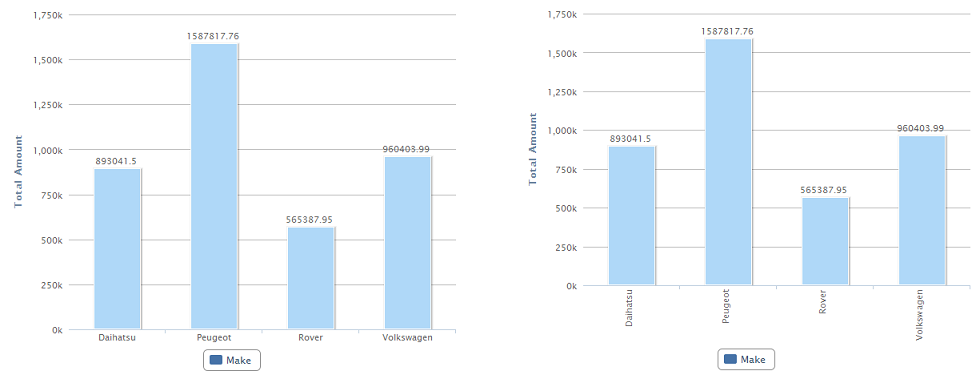
With this property we may define if the labels on the X axis will appear horizontally, vertically or rotated a certain angle.
| Horizontally |
Tags will be horizontally displayed under their values. This is the default value. |
| Rotated 30º |
Tags will appear under the values with a 30º rotation angle |
| Rotated 45º |
Tags will appear under the values with a 45º rotation angle |
| Rotated 60º |
Tags will appear under the values with a 60º rotation angle |
| Vertically |
Tags will be vertically rotated under their values. |
If the control does not have enough space to show the labels (several data to display), the labels won't be displayed. To see the information related to specific columns, you can make a mouse over in the desired column, point, or data area (depending of the Chart type used).
See the image below:
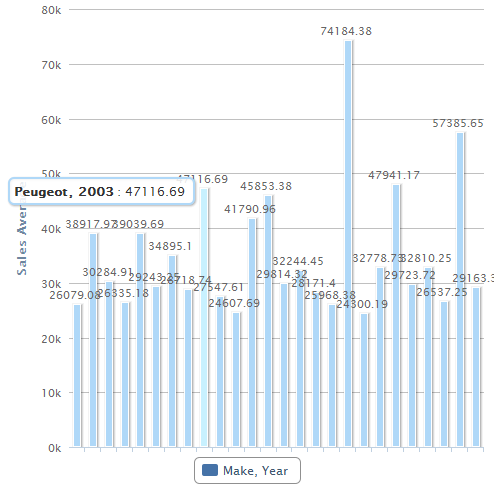
Output type Chart (Column, 3D Column, Stacked column, 3D Stacked column, Area, Stacked area and Line).